Research on effective stimulated reservoir volume
Major Activities
A typical 3D dynamic fractured reservoir model consists of approximately 10 million active grid cells containing detailed geological description of the reservoir. Due to the high amount of grid cells and the current practical operating limit of any given Central Processing Unit, the energy required to robustly simulate fractured reservoir dynamics is a challenging demand. It is often unprofitable to run complex fluid-flow and fracture propagation simulations directly on an overly-intricate geological model for any reservoir. By upscaling the 3D model, the average number of active grid cells in most simulation models can be reduced to 1% of the original value. However, it is apparent that with only 1% of active cells, attaining accurate representations of the parent model becomes improbable. Depending on the reservoir model complexity, especially for non-additive properties such as permeability, upscaling can yield even more uncertain results. This is particularly true when evaluating more complex formations for unconventional exploration like the Bakken and Wolfcamp Shale. For high uncertainty associated with any petroleum ventures, it is essential to determine and integrate numerical and data approaches to effectively evaluate fractured reservoirs.
In the past, models consisting of a single, planar hydraulic fracture has been the primary component utilized to analyze stimulation performance in conventional reservoirs. For ultra-low permeability reservoirs, a large system of fracture networks must be generated by hydraulic fracturing to economically produce hydrocarbons. Furthermore, for enhanced geothermal systems (EGS) in geothermal energy production, the fractured reservoirs must contain an inter-connected system of pre-dominantly shear fractures. Hence, the simplification of a single, planar hydraulic fracture model utilized by popular industry software is inadequate to evaluate performance in most unconventional and geothermal reservoirs. The purpose of this research is to develop of a novel framework for the dynamic characterization, prediction, and management of effective stimulated reservoir volume for relevant applications (ESRV). Effective stimulated reservoir volume is characterized by the following properties: volume, conductivity, contact area, and spatial distribution. These ESRV properties are described by employing sources of available data such as: stimulation/production, microseismic, tracer, well-logging, core samples, tiltmeter, fiber optic (Distributed Acoustic Sensing and Distributed Temperature Sensing), etc. By leveraging the combination of existing model and available data, the value of information obtained by any given monitoring technology for fractured reservoir applications are maximized. The optimal integration of simulation model and monitoring data will be used to compensate for the extensive computational demands in comprehensive numerical simulation. With this integration, hydraulic fracture architecture, the use of surveillance technology, and injection schedules can be modified to minimize completion cost and operational carbon footprint.
Project background and literature were researched starting September 2021 in order to define the project. The ultimate objective is to develop a novel framework for the dynamic characterization, prediction, and management of the effective stimulated reservoir volume (ESRV). Current simulation models and monitoring technologies were reviewed, then ordered by fractured reservoir characteristics. The characteristics of were classified in terms of volume, conductivity, area, and spatial distribution. A composite library was constructed in February 2022 containing the simulation model, data sources, associated ESRV properties and applications. By employing this library, any combinations of model and data can be selected to specifically assess ESRV properties for a given application. For example, a combination of a fractal fracture network, microseismic, and micro-deformation data can be used to evaluate the spatial distribution and connectivity of the fracture network in unconventional hydrocarbon reservoirs.
Significant Results
2D field microseismic data calibration:
In March 2022, a set of field microseismic data was used to calibrate the generation of fractals to obtain information about the fracture network. The publicly available field data was selected from the Laredo Sugg 171-A Pad GTI HFTS Project completed by Halliburton in 2015. The hydraulic fracturing test site (HFTS) project aimed to investigate fracture network interactions within several multi-well completion schemes. One of the primary data sources utilized was microseismic events obtained through microseismic monitoring arrays. To simplify the initial model, the 3D microseismic data were reduced to 2D microseismic data, which only preserves the x and y coordinates of the focus. The microseismic events were split from the lateral coordinate of the well x = -1500 ft from right to left. The fracture is assumed to propagate perpendicular to direction of minimum stress, and cannot traverse to the opposite side. For example, if the direction of fractal fracture growth is to the left side of the borehole, the entire fracture will be restricted to the left side. The microseismic data calibrated fractal fracture network shown in Figure 1. The fractal fracture was able to be calibrated by field microseismic events data. Additionally, the left and the right side of the borehole showed two distinct fracture network spatial distributions. The left side of the borehole showed a more dispersed fracture network, while the right side is condensed in x-direction.
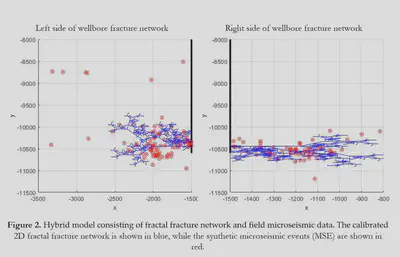
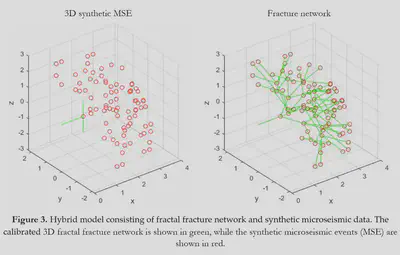
Since 3D microseismic data is reduced to 2D microseismic data in Figure 1, the dimension of the generated fracture network is physically constrained to the x and y plane. In order to represent all spatial dimensions, a 3D fractal fracture calibration model is introduced to match the 3D microseismic data. The matching process is done sequentially with the starting position at the wellbore. The first rendition of an integrated 3D microseismic calibration is shown in Figure 2. The proposed fractal fracture calibration model is able to match all instances of the synthetic 3D microseismic events.
Using the same set of data from the Laredo Sugg 171-A Pad GTI HFTS Project completed by Halliburton in 2015, a time-step data analysis of the 3D microseismic data was performed. To ensure high quality microseismic data were utilized, a signal-to-noise ratio (SNR) of 2 was used to filter the events. Additionally, only the first stage of hydraulic fracturing was used to ensure zero stage or well interference. The purpose of the filter was to assess the amount of information that can obtained by microseismic monitoring, given that the data is highly certain. After filtering by SNR, the microseismic data were sectioned by 20-minutes time slices, with 8 total slices. The 3D microseismic events time-slices are shown in Figure 3.
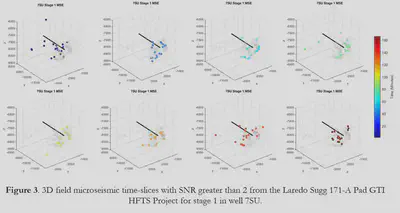
Observation of the time-slices show that calibration of 3D microseismic data must require the inclusion of the time dimension. There are no blooming patterns observed starting from the wellbore, as the events can occur far away from the wellbore in early times and closer to the wellbore at later times. This indicates that the complexity of the fracture network increases with time, while the extent of the fracture network does not. Additionally, current events occur within region of past events, which indicates that one induced natural fracture may cause another nearby to be activated, rather than the hydraulic fracture activating all of the natural fracture in its proximity.